Turnover
| Year | 2012 | 2013 | 2014 | 2015 | 2016 | 2017 | 2018 |
| Turnover. (K€) | 10259 | 8850 | 10213 | 7700 | 7900 | 7600 | 8225 |

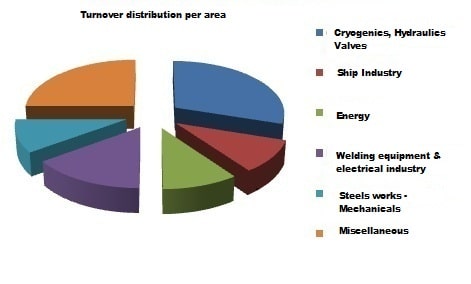
Turnover distribution per area
- Cryogeny, Hydraulics, Valves 30 %
- Ship Industry 10 %
- Energy 10 %
- Welding equipment and electrical industry 15 %
- Steel works - Mechanicals 10 %
- Miscellaneous 25 %
- Export share 20% of turnover
Number of employees
- Total staff : 63
- Production staff: 52
- Average age: 42 years
- Seniority: 15 years


